Machine Learning Sequence Prediction for Stocks
Project Github | Project Website | API Documentation | Presentation Poster | Project Partner Attribution: Shashank Swaminathan
For the final project of my Machine Learning class, my project partner and I created an API for stock price prediction. Our approach included combining a recurrent neural network (RNN) and a gaussian process model (GPM) to create a confidence interval of future stock prices given a sequence of training stock prices.
LSTM Design Considerations
My primary contribution was implementing a long-term short-term (LSTM) RNN. When fed a sequence of day-over-day percent change values for a sequence, it can generate a sequence based on a combination of the model weights found during training and the information from the input sequence. Specifically, the model only predicts day-over-day percent changes in the stock.
LSTMs can process sequences of arbitrary length with any pre-defined number of features, and output a sequence with a different and arbitrary number of features. While stock prices are inherently unpredictable, we built our model on the notion that there may exist learnable relationships between companies’ stocks. As such, each feature vector of the input sequence contains not only the stock price of the company whose price we wish to predict, but also the stock prices of other companies.
Using the LSTM in Code
The LSTM prediction capability is encapsulated in a class designed to integrate with the stock market data collection code. The result of this infrastructure is that anyone using our code can specify a ticker of the company whose stock data the model will be trained on (along with any number of other companies whose data is added as features to the dataset), the date range from which to collect the data, train the model, and generate and plot predicted sequences all with just a few lines of code.
Example from the main routine in StockRNN.py:
# Predict AAPL stock and use GOOGL, MSF, and MSI stocks as
# additional features
model = StockRNN("AAPL", to_compare=["GOOGL", "MSFT", "MSI"],
train_start_date=datetime(2012, 1, 1),
train_end_date=datetime(2019, 1, 1),
try_load_weights=True)
# Uncomment to get dataset preview
# model.peek_dataset()
try:
model.to(DEVICE)
model.__togpu__(True)
except RuntimeError:
print(TO_GPU_FAIL_MSG)
except AssertionError:
print(TO_GPU_FAIL_MSG)
model.__togpu__(False)
model.do_training(num_epochs=100)
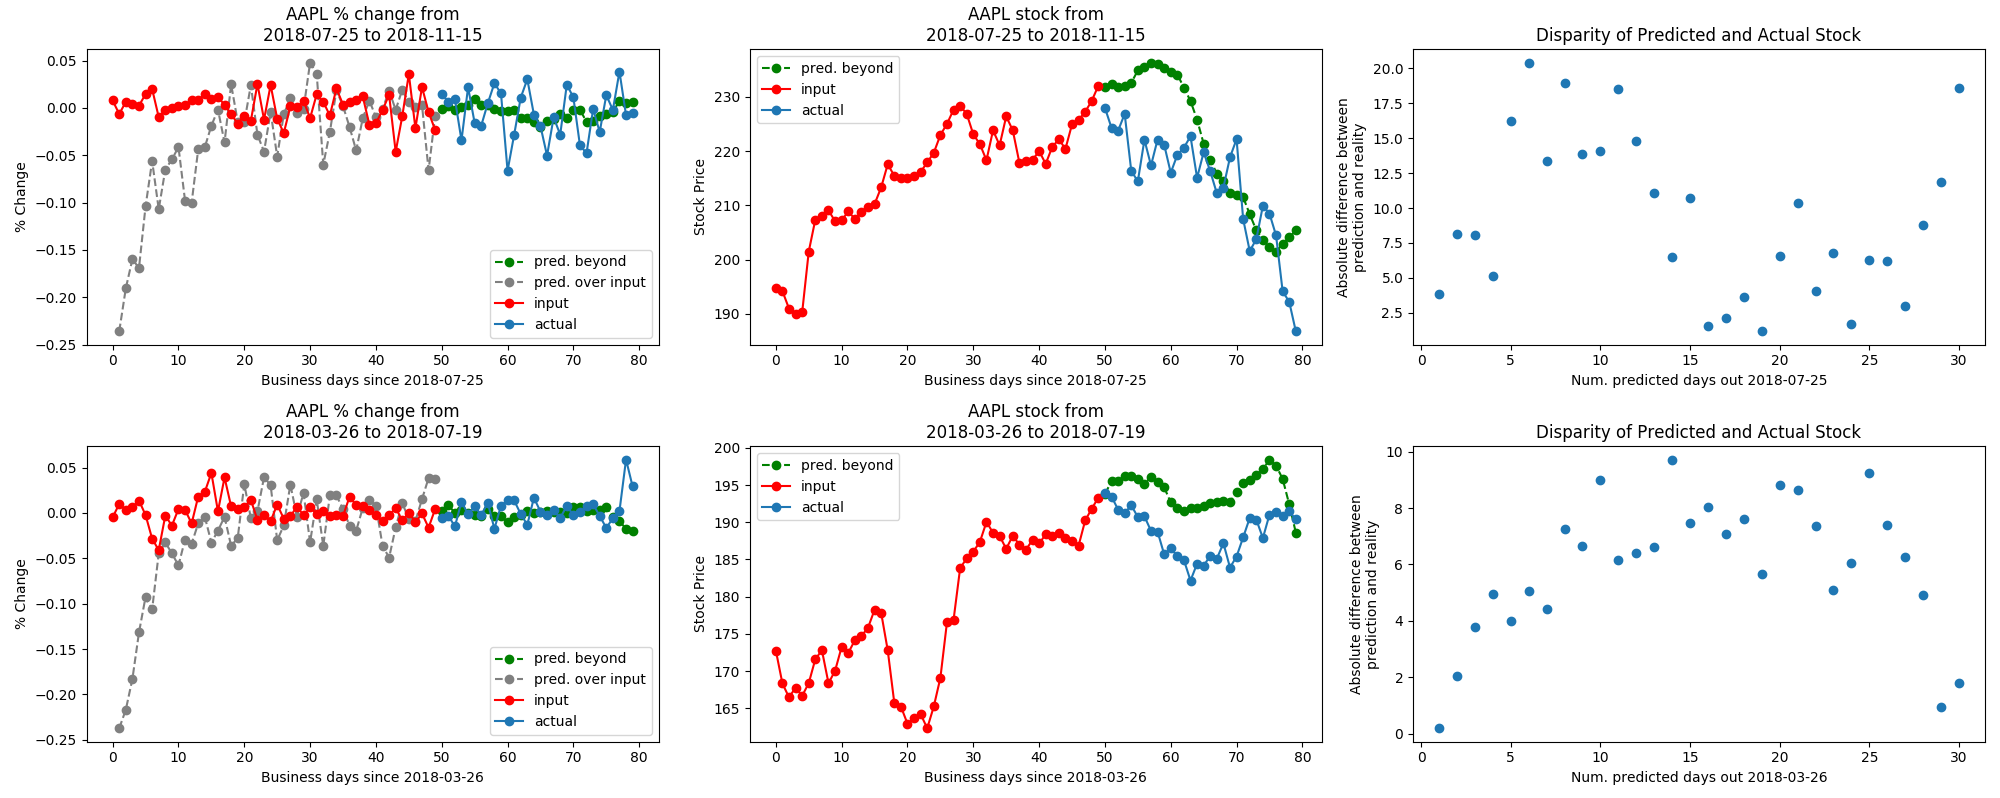
model.plot_prediction_with_validation()
model.plot_predicted_distribution(12)
Future Work and Assumptions for Combining LSTM and GPM
The LSTM model’s efficacy needs to be evaluated in greater detail using quantitative metrics (as opposed to the current qualitative analysis of plots):
- What characterizes a validation data set where the model performs well vs. poorly?
- To what extent do additional features (i.e., other stocks used for comparison) improve accuracy?
Additionally, when combining the outputs of the LSTM and the GPM, we made the assumption that, given the same input data, the LSTM outputs sequences that can be approximated by a gaussian distribution. By extracting a gaussian distribution from the output of the LSTM, it became straightforward to combine with the GPM output. However, it remains to be validated how closely the LSTM output follows a gaussian distribution, as well as what relative weighting of the GPM and LSTM results in the most accurate predictions.
Other specific issues that need addressing are mentioned on the API documentation site.
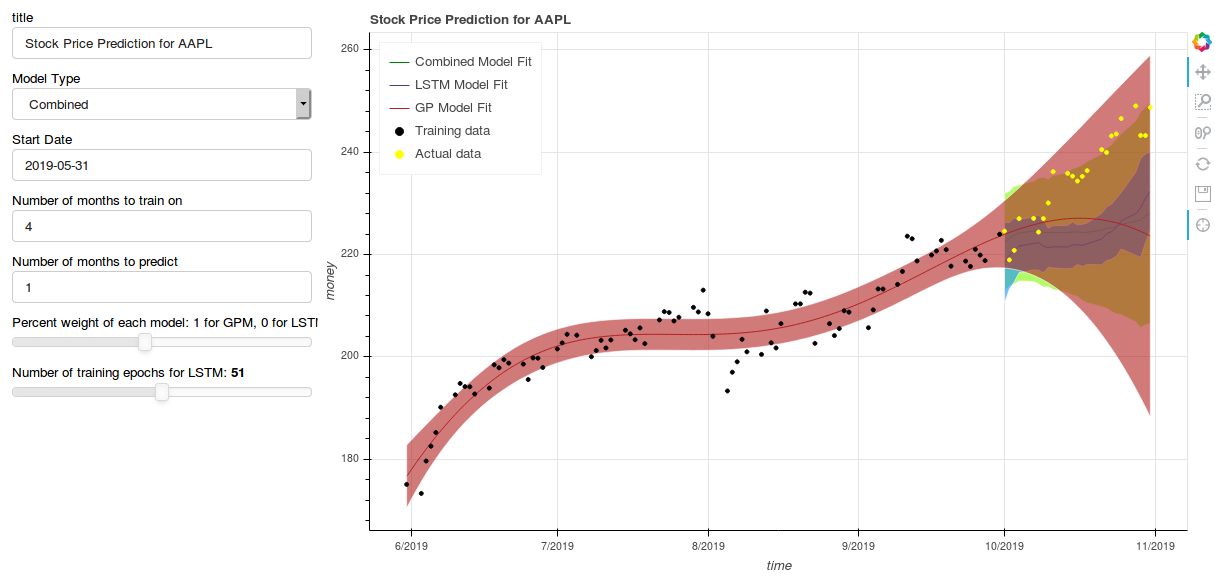
GUI
To go beyond the Python with matplotlib scripting interface, my project partner and I integrated the LSTM model and the GPM into an interactive locally-hosted website:
bokeh serve --show .
This made it easy to visualize the resulting confidence intervals created by the models alongside each other.
Another machine learning project I worked on: colorizing grayscale images.